Home Builders Are Trading Margin for Demand as Incentives Reach 63%
The US housing market in July 2026 is operating under a concession regime that has no recent precedent in its duration. The NAHB/Wells Fargo Housing Market Index fell two points to 34 in July from an upwardly revised 36 in June, missing the consensus forecast of 35. Builder confidence has now remained below 40 for 15 consecutive months—the longest such stretch since 2012. The headline index number understates the structural adjustment underway: 63% of builders are now offering sales incentives, up from 62% in June and at least 60% for 16 consecutive months. Meanwhile, 37% of builders are cutting prices outright, up from 35% in June and 32% in May. The industry is systematically trading margin for demand, and the question is whether this strategy can sustain sales volumes without permanently impairing builder economics.
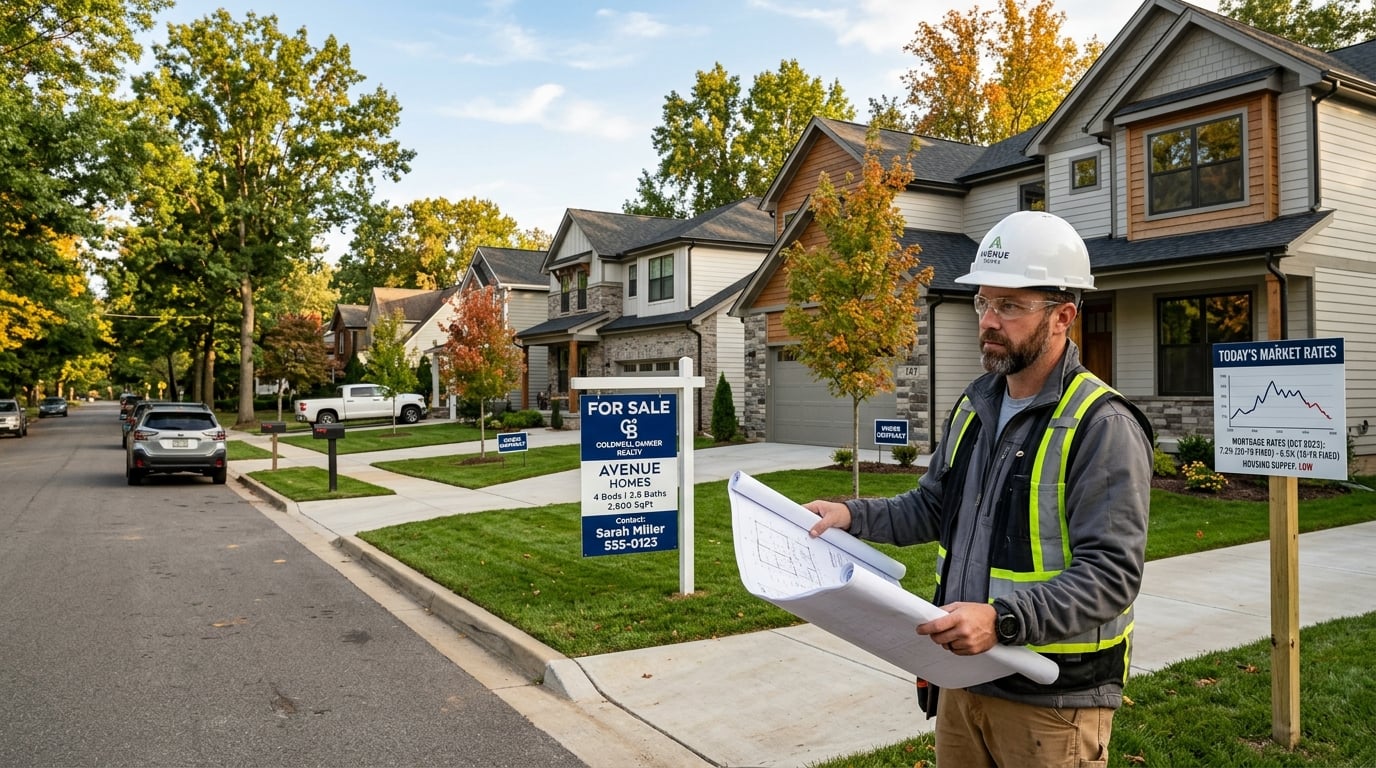
The Affordability Constraint: Mortgage Rates Above 6.5%
The primary driver of the housing market's distress is mortgage rate affordability. Freddie Mac's 30-year fixed mortgage average was 6.55% on July 16, up from 6.49% on July 9 and 6.43% on July 2. The 15-year fixed average was 5.93% on July 16. These rates represent a significant increase from the sub-3% environment of 2020–2021 and have fundamentally altered the affordability calculus for prospective buyers.
At 6.55%, a $400,000 mortgage carries a monthly principal and interest payment of approximately $2,530—compared to roughly $1,686 at a 3% rate. This $844 monthly difference represents a 50% increase in debt service costs for the same loan amount. For many prospective buyers, this increase has pushed homeownership beyond their financial reach, particularly in markets where home prices have not declined proportionally to offset the higher financing costs.
The Concession Chain: How Builders Are Responding
Builders have responded to the affordability constraint through a systematic concession strategy. The 63% incentive rate—which includes mortgage rate buydowns, closing cost assistance, appliance packages, and design upgrades—represents the industry's primary tool for bridging the gap between what buyers can afford and what homes cost to build and sell at a profit. The average price reduction of 6% among the 37% of builders cutting prices provides a secondary affordability lever.
Mortgage rate buydowns deserve particular attention. In a buydown arrangement, the builder pays an upfront fee to the mortgage lender to reduce the buyer's interest rate for a specified period—typically two to three years. A 2-1 buydown, for example, reduces the rate by 2 percentage points in the first year and 1 percentage point in the second year before reverting to the market rate. This structure makes the initial monthly payments more manageable but does not address the long-term affordability challenge when the buydown expires.
The 16-month streak of incentive use above 60% indicates that these concessions are not a temporary response to a brief market disruption. They have become a structural feature of the new-home sales process, embedded in builder pricing models and marketing strategies. The cost of these incentives is ultimately borne by builders through reduced gross margins, which has implications for builder profitability and their ability to invest in new land acquisition and development.
Buyer Traffic: The Leading Indicator
Prospective-buyer traffic fell two points to 23 in July—the weakest component of the NAHB index and the most forward-looking indicator of future sales. Traffic measures the number of potential buyers visiting model homes and sales offices, and a reading of 23 indicates that very few prospective buyers are actively shopping for new homes. This is consistent with the affordability data: when monthly payments are significantly higher than buyers anticipated or can manage, the first response is to delay the purchase decision rather than immediately exit the market.
The six-month sales expectations component dropped two points to 43, suggesting that builders themselves are not optimistic about a near-term recovery. A reading below 50 indicates that more builders expect conditions to worsen than improve over the next six months. This pessimism is notable because builders typically have better visibility into their own sales pipelines than external analysts, making their forward expectations a meaningful signal.
June Pending Home Sales: A Confirming Signal
June pending home sales reportedly fell 5.4% from May, providing additional evidence that the existing-home market is also under pressure. Pending sales measure contracts signed but not yet closed, making them a leading indicator of closed sales one to two months forward. A 5.4% monthly decline suggests that the existing-home market is not providing a meaningful alternative for buyers priced out of new construction.
The Policy Backdrop: 21st Century ROAD to Housing Act
The housing industry has expressed cautious optimism about the 21st Century ROAD to Housing Act, which aims to streamline permitting processes and reduce regulatory barriers to new construction. If implemented effectively, permitting reforms could lower the cost and time required to bring new homes to market, potentially improving affordability over the medium term. However, the practical impact of permitting reforms depends heavily on local implementation, and the timeline for meaningful supply additions is measured in years rather than months.
For investors, the current housing market data presents a clear picture: affordability constraints are severe, builder confidence is depressed, and the concession strategy is sustaining sales at the cost of margins. The market's recovery depends on either a meaningful decline in mortgage rates—which requires lower Treasury yields and a more dovish Fed—or a significant increase in buyer income and purchasing power. Neither condition appears imminent in the current macroeconomic environment.
This content is for informational purposes only and does not constitute financial advice. Always consult with a qualified financial advisor before making investment decisions.
Discussion