China Stocks Slide as Export Strength Masks Property and Investment Weakness
China's equity markets delivered a stark reminder this week that strong trade data and weak domestic demand can coexist — and that investors who focus only on headline export figures risk missing the more troubling story unfolding beneath the surface. The Shanghai Composite fell 3.05% to 3,764.15 on July 17, 2026, while the Shenzhen Component dropped a steeper 5.4%, bringing the Shanghai index's weekly loss to 5.81%. The selloff came despite June export growth of 27% year-on-year — a figure that would normally be cause for celebration.
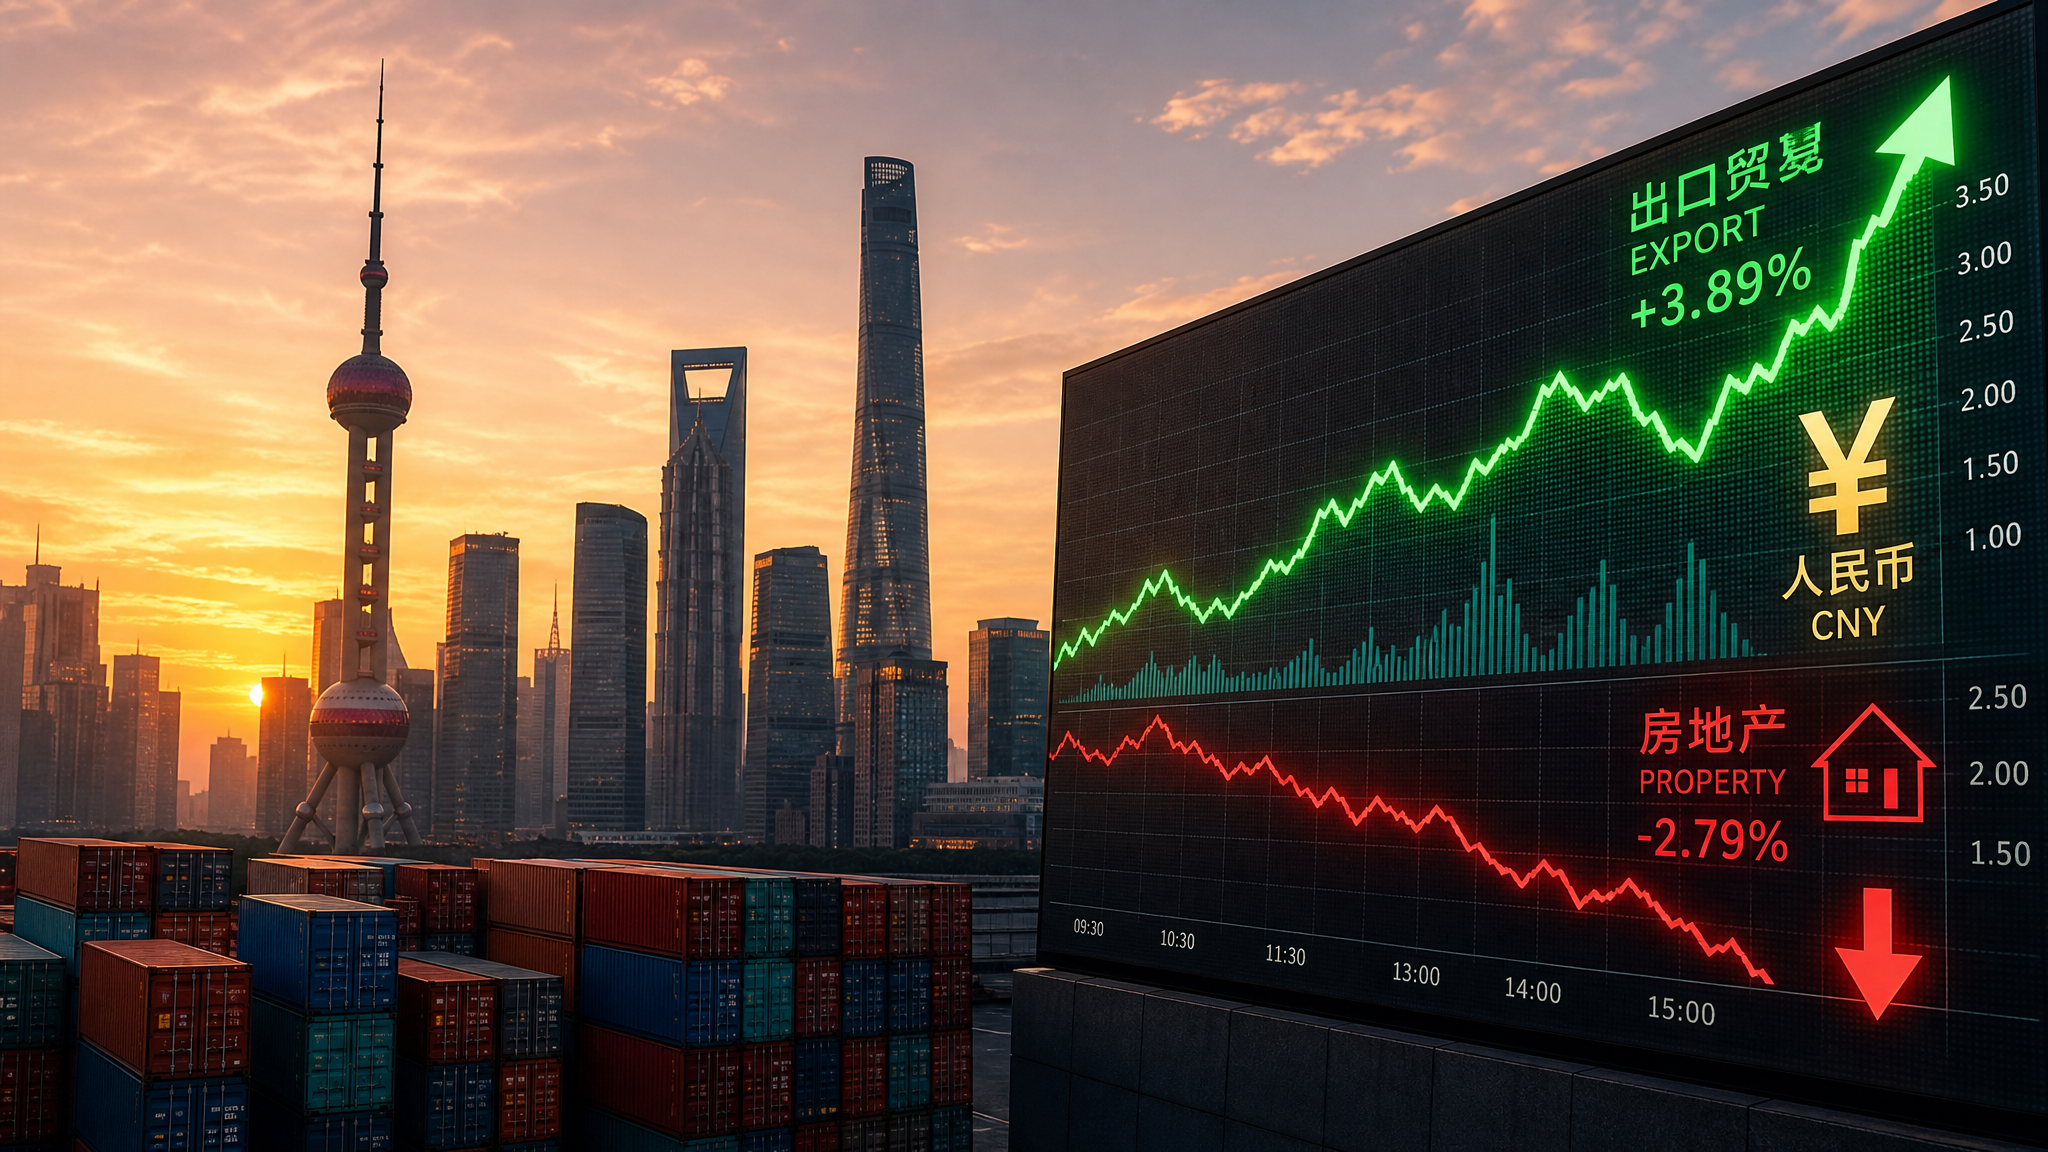
The divergence between China's external sector and its domestic economy has rarely been more pronounced, and understanding this two-speed dynamic is essential for anyone trying to navigate Chinese equities in the second half of 2026.
The Macro Picture: Two Economies in One
China's National Bureau of Statistics released second-quarter GDP data showing growth of 4.3% year-on-year and 0.9% quarter-on-quarter — a deceleration from the first half's 4.7% pace. First-half GDP totaled 69,570.4 billion yuan. On the surface, these numbers look respectable. But the composition tells a very different story.
June industrial output rose 5.3% year-on-year, and exports surged 27% — with imports also jumping 36%, suggesting strong demand for inputs tied to manufacturing and re-export activity. These figures reflect China's competitive strength in semiconductors, rare earths, electric vehicles, and shipbuilding. Some analysts have attributed part of the export surge to front-loading ahead of potential tariff changes, which would make the headline figure less durable than it appears.
Set against this external strength, domestic demand remains deeply subdued. June retail sales grew just 1.0% year-on-year — barely above stagnation. First-half fixed-asset investment contracted 5.7%, and real-estate development investment plunged 18%. These are not the numbers of an economy firing on all cylinders; they are the numbers of an economy where the export engine is running hot while the domestic engine sputters.
The Property Sector: Still the Central Drag
China's property market remains the most significant structural constraint on domestic demand. Secondary-home prices across 100 cities fell 0.42% month-on-month in June, with declines recorded in 88 of those cities. Year-on-year, prices fell 6.95% in first-tier cities, 8.21% in second-tier cities, and 7.48% in third- and fourth-tier cities. These are not marginal corrections — they represent a sustained destruction of household wealth that is directly suppressing consumer confidence and spending.
The property sector's 18% contraction in development investment is particularly significant because construction activity has historically been one of the most powerful multipliers in China's economy, generating demand for steel, cement, appliances, and a wide range of services. Until this drag stabilizes, the domestic economy will struggle to generate the kind of broad-based recovery that equity markets need to sustain a durable rally.
PBOC's Targeted Response: Liquidity Without a Rate Cut
The People's Bank of China has responded to the slowdown with targeted liquidity support rather than an outright benchmark rate cut. The seven-day reverse-repo rate was held at 1.40%, while a new overnight facility was introduced at 1.25%. More significantly, the PBOC injected 1.4 trillion yuan — approximately $207 billion — through six-month outright reverse repos, and expanded its standing swap arrangement with the Hong Kong Monetary Authority to 500 billion yuan.
This approach reflects the PBOC's preference for managing funding conditions without sending a broad easing signal that could further weaken the yuan or inflate asset bubbles. The question is whether targeted liquidity support can substitute for the kind of demand-side stimulus that would actually move the needle on retail sales and property investment. The evidence so far suggests it cannot — at least not on its own.
Equity Market Dynamics: ETF Buying Versus Panic Selling
The equity correction has both valuation and liquidity dimensions. The Shanghai Composite is now approximately 10% below recent highs, while the ChiNext growth index has fallen roughly 20%. Investors are also concerned that a proposed $8.6 billion CXMT semiconductor offering and other large listings could absorb market liquidity at a time when sentiment is already fragile.
Against this backdrop, one counter-signal has emerged: ETFs tracking the CSI 300 and CSI 1000 added more than 30 billion yuan — approximately $4.4 billion — in assets during the week to July 17. This suggests that some longer-horizon institutional investors viewed the decline as a potential bottoming zone, even as individual shares faced panic selling. Whether this institutional buying represents genuine conviction or simply mechanical rebalancing remains to be seen.
What to Watch: The Path to a Durable Recovery
A sustainable rebound in Chinese equities requires more than inexpensive valuations. It requires the market to absorb new issuance without renewed selling, evidence that ETF inflows are broadening and sustained, and — most importantly — signs that domestic demand is genuinely recovering. The key indicators to monitor are monthly retail sales data, property transaction volumes in major cities, and whether northbound flows through Stock Connect turn consistently positive.
For investors, the most credible opportunities in China right now lie in externally competitive manufacturing and trade-linked businesses — not in sectors dependent on housing, construction, or discretionary domestic spending. The two-speed economy demands a two-speed investment approach.
This content is for informational purposes only and does not constitute financial advice. Always consult with a qualified financial advisor before making investment decisions.