The Treasury Curve's 37-Basis-Point Slope Signals a Risk Beyond the Next Fed Decision
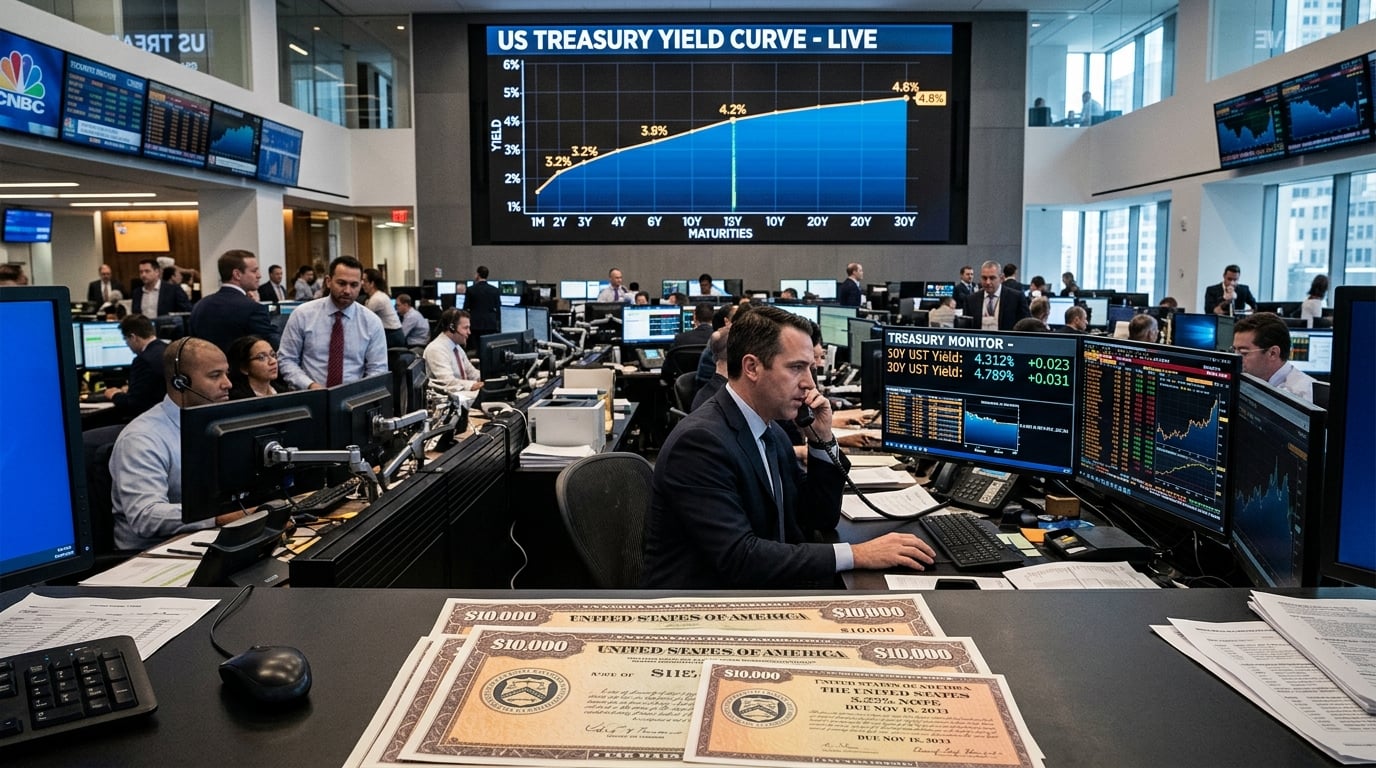
The US Treasury yield curve as of July 17 presented a configuration that deserves careful interpretation. The 2-year yield stood at 4.18%, the 10-year at 4.55%, and the 30-year at 5.06%. The 2-year/10-year spread of approximately 37 basis points indicates an upward-sloping curve—conventionally a positive signal for economic growth expectations. But the current curve's shape reflects a more complex dynamic than the textbook interpretation suggests. Short-term yields have eased modestly on softer labor data, while long-term yields remain elevated due to persistent inflation uncertainty and fiscal concerns. The result is a curve that is technically positive but operationally restrictive for rate-sensitive assets.
What the 2-Year Yield Is Telling You
The 2-year Treasury yield is the market's most direct expression of near-term Federal Reserve policy expectations. At 4.18%, it reflects a consensus view that the Fed will hold rates in the 3.50%–3.75% target range for the foreseeable future, with a modest probability of a 25-basis-point increase at the July 28–29 FOMC meeting. The 2-year yield has eased from higher levels earlier in the year, partly in response to a June payroll report that showed weaker-than-expected job creation—one account cited 57,000 additions against a 115,000 consensus, though this figure should be treated as a contested single-source claim pending official confirmation.
The key insight from the 2-year yield is that the market is not pricing aggressive tightening. The probability of a July hike is approximately 25%, and the market is not pricing a sustained series of increases. This reflects the Fed's own messaging: officials have kept hikes possible without committing to them, and the data-dependent framework means each release can shift expectations in either direction.
What the 10-Year Yield Is Telling You
The 10-year Treasury yield is a different instrument from the 2-year. While the 2-year primarily reflects near-term policy expectations, the 10-year incorporates a longer horizon that includes growth expectations, inflation risk, and the term premium—the additional compensation investors demand for holding longer-duration bonds. At 4.55% on July 17 and testing 4.6% intraday on July 21, the 10-year is signaling that long-duration investors are not fully convinced that inflation is on a durable downward path.
June CPI's 0.4% monthly decline was encouraging, but the energy component's 5.7% fall was the primary driver. Core CPI was flat monthly and 2.6% annually—still above the Fed's 2% target. If energy prices remain elevated through July, as current Brent crude levels suggest, the headline CPI improvement may partially reverse. Long-duration investors are pricing this risk by keeping the 10-year yield elevated even as short-term yields have eased.
The 30-Year Above 5%: A Fiscal Signal
The 30-year Treasury yield above 5.06% is the most significant data point in the current curve configuration. At this level, the 30-year is pricing not just inflation risk but also fiscal risk—the concern that the US government's long-term borrowing trajectory is unsustainable without either higher taxes, lower spending, or some combination of the two. The 30-year yield is the market's long-run assessment of the cost of US sovereign debt, and a sustained level above 5% reflects genuine investor concern about the fiscal outlook.
This matters for equity investors because the 30-year yield sets the long-run discount rate for corporate cash flows. A 30-year yield above 5% means that the risk-free rate for very long-duration assets is meaningfully competitive with equity earnings yields, particularly for growth stocks whose valuations depend on cash flows many years in the future. The current configuration is therefore a structural headwind for high-multiple technology and growth stocks, independent of near-term earnings results.
The 3-Month/10-Year Spread: A Different Lens
The 3-month/10-year spread of approximately 75 basis points provides a complementary perspective. This spread was deeply inverted for much of 2023 and 2024, signaling recession risk. Its return to positive territory suggests that the most acute phase of yield-curve inversion—and the associated recession signal—has passed. However, a 75-basis-point spread is not historically wide, and the curve's normalization has been driven more by short-term yield declines than by long-term yield increases, which limits the positive signal.
Implications for Rate-Sensitive Assets
The current yield curve configuration has direct implications for several asset classes. For equities, the 10-year yield near 4.6% raises the hurdle rate for earnings growth, particularly in sectors with high price-to-earnings multiples. For the housing market, the 30-year mortgage rate—currently around 6.55% according to Freddie Mac's July 16 data—is directly influenced by the 10-year Treasury yield, and any further increase in the 10-year would push mortgage rates higher, further constraining affordability. For corporate borrowers, the elevated long-term yield environment increases the cost of refinancing existing debt and issuing new bonds.
The central thesis for investors is that softer near-term data can reduce immediate tightening expectations—as reflected in the 2-year yield—without producing a corresponding decline in long yields. The 10-year and 30-year yields are responding to a different set of factors: long-run inflation uncertainty, fiscal sustainability concerns, and the term premium. Until these longer-run concerns are resolved, the curve's shape will continue to impose a valuation constraint on rate-sensitive assets.
This content is for informational purposes only and does not constitute financial advice. Always consult with a qualified financial advisor before making investment decisions.
Discussion