Treasury Yields at 18-Month Highs: Oil, Labor Data, and the Fed's Shrinking Balance Sheet Drive the Repricing
The U.S. Treasury market experienced a significant repricing on July 23, 2026, as the 10-year yield climbed to 4.71% — its highest level since January 2025. The move was not driven by a single catalyst but by the convergence of three reinforcing forces: surging oil prices that revived inflation concerns, a jobless claims reading of 187,000 that signaled a labor market far tighter than expected, and a Federal Reserve balance sheet that continues to shrink through quantitative tightening, reducing the pool of reserves available to absorb Treasury supply. Together, these forces pushed yields higher across the curve, with the 2-year note at 4.343% and the 30-year bond at 5.188%.
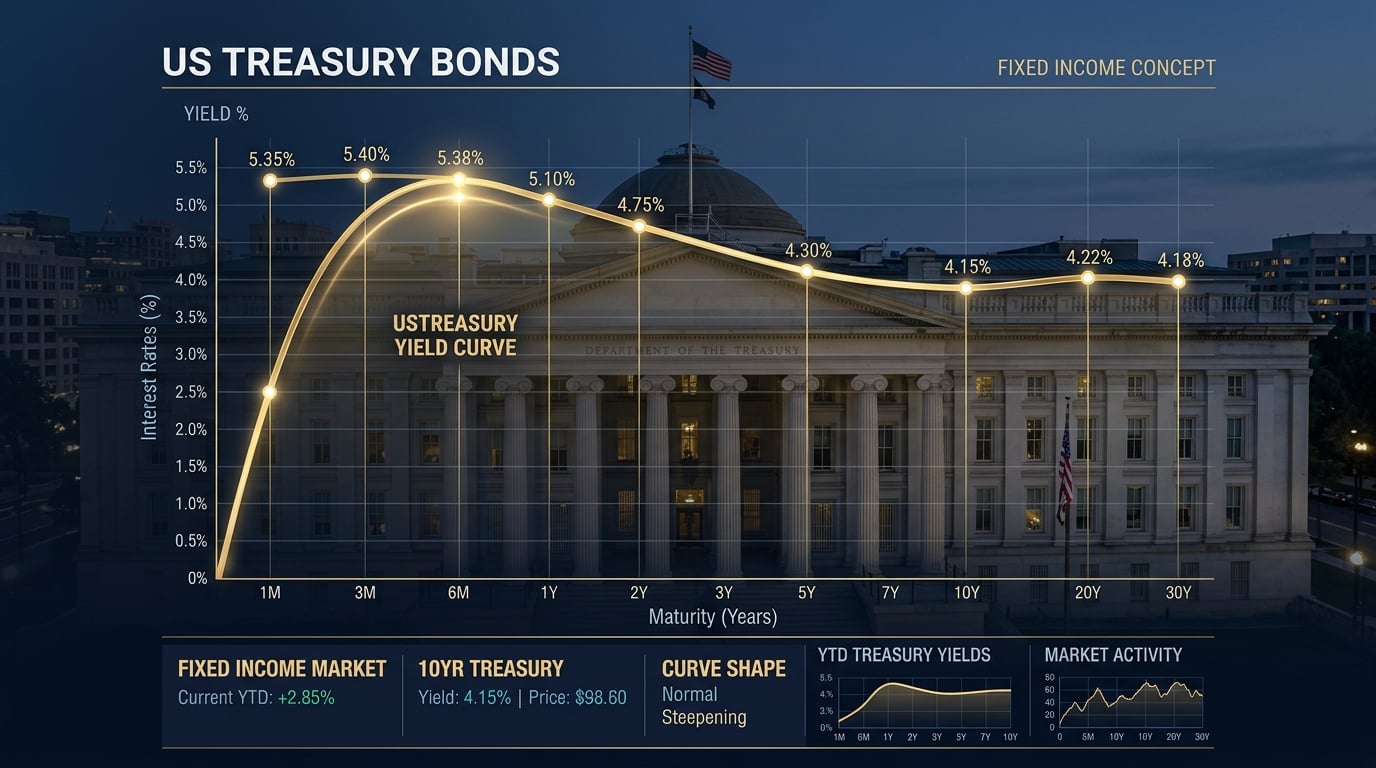
Reading the Yield Curve
The current configuration of the Treasury yield curve — 2-year at 4.343%, 10-year at 4.71%, and 30-year at 5.188% — tells a specific story about market expectations. The spread between the 2-year and 10-year yields is approximately 37 basis points, a modestly positive slope that reflects the market's view that short-term rates will eventually come down from current levels, but not quickly. The spread between the 10-year and 30-year yields is approximately 48 basis points, suggesting that investors demand additional compensation for the uncertainty associated with holding very long-duration bonds in an environment where inflation and policy risks remain elevated.
The 30-year yield at 5.188% is particularly significant for long-duration investors, including pension funds, insurance companies, and sovereign wealth funds that use long-dated Treasuries to match their long-term liabilities. At these levels, the 30-year bond offers a real yield — after adjusting for inflation expectations — that is meaningfully positive, which may attract demand from liability-driven investors even as the macro environment remains uncertain. That demand could provide a natural ceiling for 30-year yields, even if shorter maturities continue to rise.
Oil's Role in the Yield Move
The surge in crude oil prices on July 23 — with WTI moving toward $94 per barrel and Brent briefly above $100 — was a direct catalyst for the yield move. Oil prices affect Treasury yields through two channels. The first is the inflation expectations channel: higher oil prices raise headline consumer price inflation, which erodes the real value of fixed-income cash flows and prompts investors to demand higher nominal yields as compensation. The second is the growth channel: very high oil prices can slow economic growth by acting as a tax on consumers and businesses, which would eventually reduce inflation and allow the Fed to ease — but that effect operates on a longer horizon than the immediate inflation concern.
On July 23, the inflation channel dominated. The combination of a tight labor market and rising energy costs created a scenario in which the Fed's preferred inflation measures — particularly the core personal consumption expenditures deflator — could remain elevated or even re-accelerate in the coming months. That prospect pushed investors to price in a more restrictive policy path, which translated directly into higher yields across the curve.
The Fed's Balance Sheet: A Structural Headwind for Bonds
The Federal Reserve's balance sheet stood at $6.74 trillion in the most recent available data, with reserves at $3.14 trillion. The Fed has been reducing its holdings through quantitative tightening — allowing maturing securities to roll off without reinvestment — since 2022. That process reduces the supply of reserves in the banking system and, over time, reduces the Fed's presence as a buyer of Treasury securities. The practical effect is that the Treasury market must absorb a larger share of new issuance from private investors, who demand higher yields than the Fed did when it was actively purchasing bonds.
The interaction between quantitative tightening and the Treasury's issuance calendar is a structural headwind for bond prices that operates independently of the short-term policy rate. Even if the Fed holds rates steady at the July meeting, the ongoing balance sheet reduction continues to put upward pressure on term premiums — the additional yield investors demand for holding longer-duration bonds rather than rolling over short-term instruments. The 30-year yield at 5.188% reflects, in part, a term premium that has risen as the Fed's balance sheet has shrunk.
Implications for Equities and Credit
Treasury yields at these levels have direct implications for other asset classes. For equities, higher risk-free rates increase the discount rate applied to future earnings, reducing the present value of growth stocks in particular. The Nasdaq's 2.70% decline on July 23 is consistent with this mechanism. For corporate credit, higher Treasury yields raise the base rate on which corporate bond spreads are layered, increasing borrowing costs for companies that need to refinance debt or fund new investment. Investment-grade spreads have remained relatively contained, but the absolute level of corporate borrowing costs has risen meaningfully as Treasury yields have climbed.
For mortgage borrowers, the 10-year yield at 4.71% translates into 30-year fixed mortgage rates that are likely to remain above 7%, continuing to suppress housing affordability and transaction volumes. The housing market's sensitivity to Treasury yields makes it one of the most direct transmission channels through which monetary policy affects the real economy — and at current yield levels, that transmission is clearly restrictive.
This content is for informational purposes only and does not constitute financial advice. Always consult with a qualified financial advisor before making investment decisions.
Discussion