From Hormuz to Chinese Ports: How Asia Is Rerouting Energy and Metals
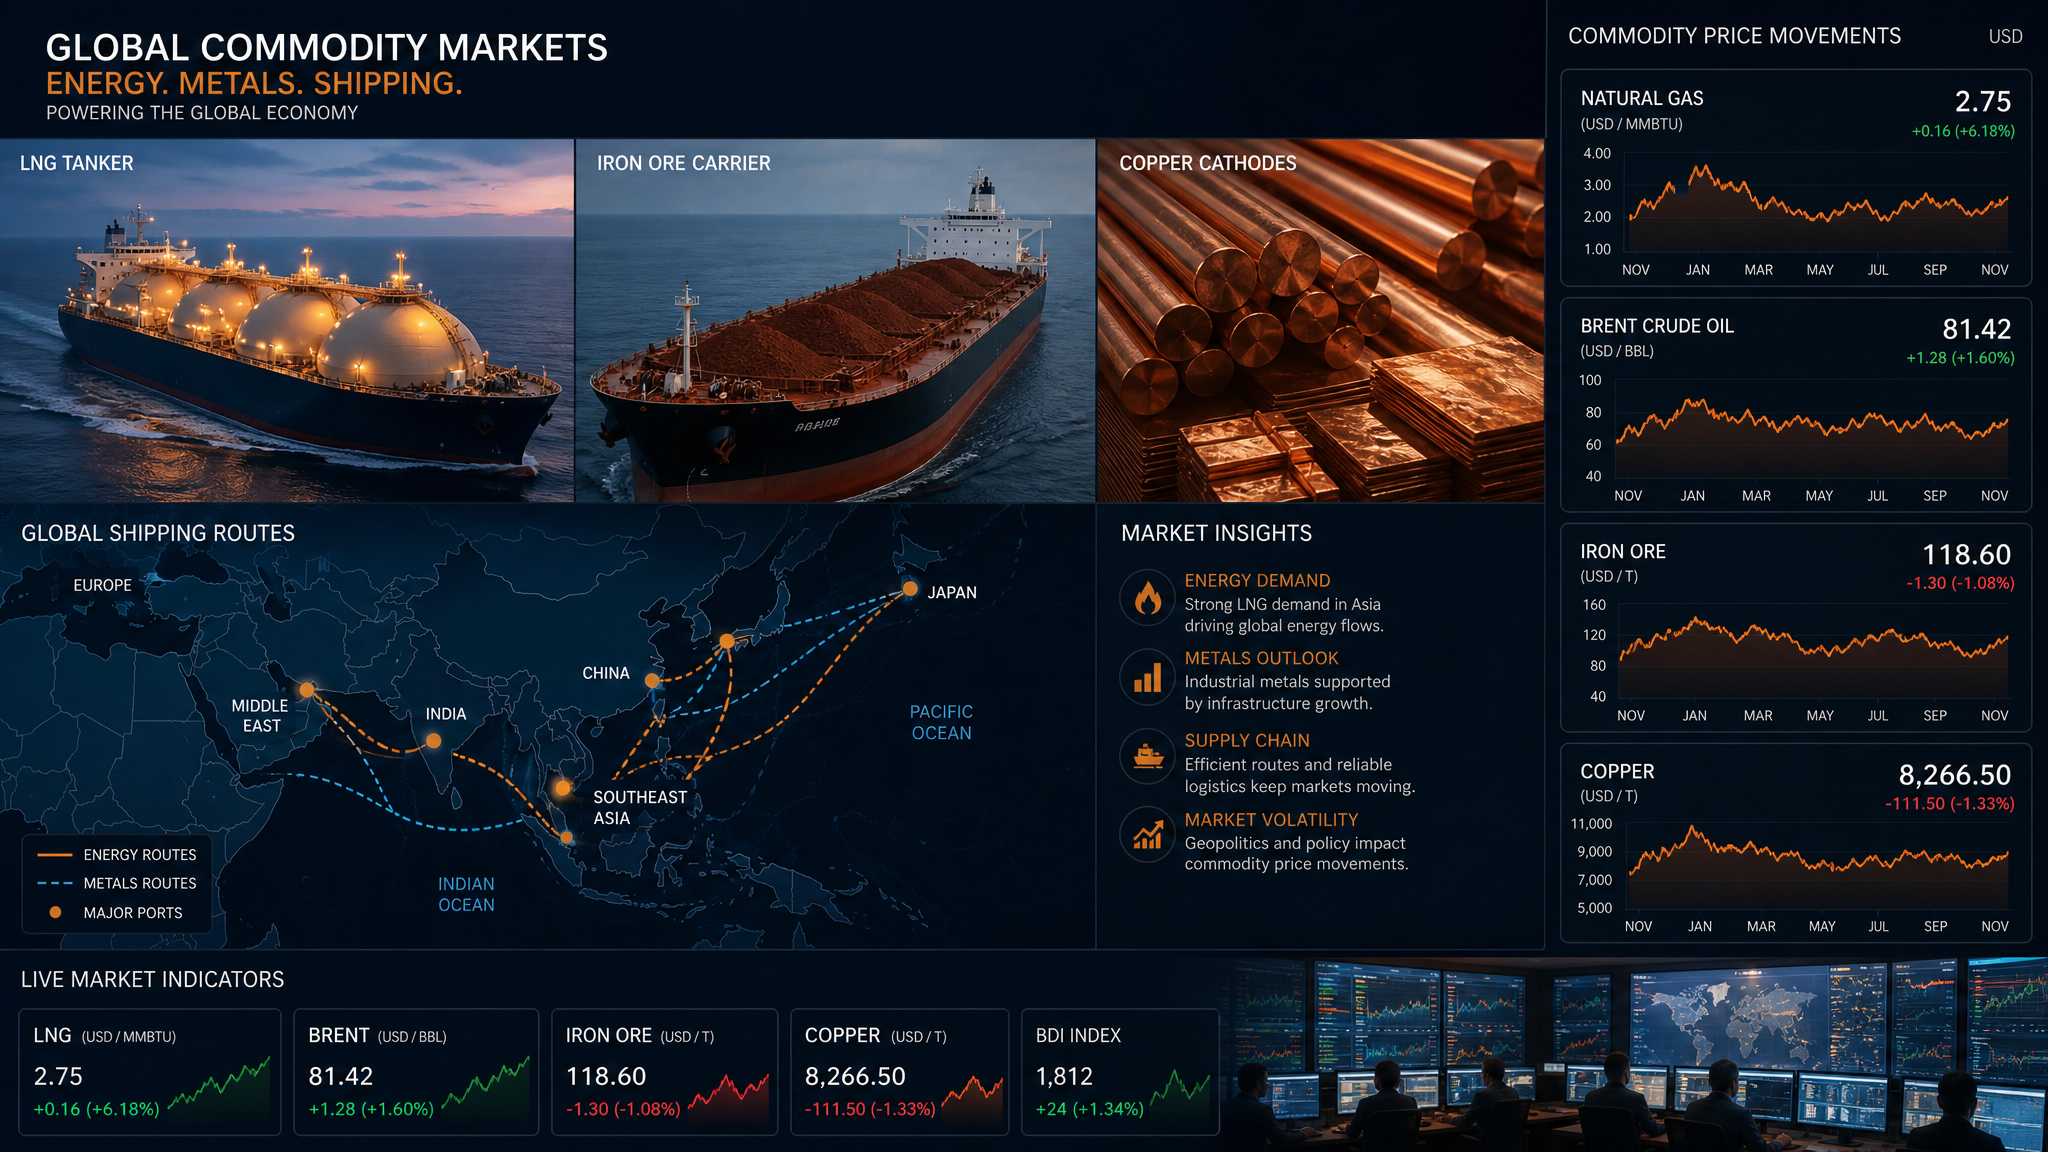
Asia's commodity map is being redrawn in real time. Disruption around the Strait of Hormuz — which carries approximately 20% of global oil traffic and, according to the IEA, accounted for roughly 20% of global LNG supply in 2025, with about 90% of those volumes destined for Asia — has forced buyers across the region to find alternative sources, reroute cargoes and in some cases substitute fuels. The result is a commodity picture where iron ore is below $100 per tonne despite rising Chinese imports, LNG is at $18 per mmBtu despite recovering Asian demand, copper is near multi-year highs despite a Chinese import slump earlier in the year, and coal is benefiting from substitution demand even as metallurgical prices soften. Each price tells a different story about who is buying, why, and whether the demand is consumption or stockpiling.
LNG: The Rerouting Story
Asian LNG imports were estimated at 23.05 million tonnes in July, the fourth consecutive monthly rise and a six-month high. The recovery followed a sharp disruption: the IEA estimated that Gulf LNG loadings fell by 35 billion cubic metres between March and June, with damage to Qatar's Ras Laffan infrastructure requiring an estimated three to five years of repair and contributing to a projected 140 billion cubic metre cumulative supply loss through 2030. Non-Gulf producers replaced roughly three-quarters of the lost supply, but the rerouting came at a cost — Asian spot LNG reached $18 per mmBtu on July 10, well above the $16–$17 range that had prevailed before the disruption.
The most significant shift in supply sourcing was toward U.S. LNG. U.S. exports to Asia were projected at a record 4.23 million tonnes in July, roughly three times February's level. Japan's U.S. LNG imports were estimated at 940,000 tonnes and South Korea's at 870,000 tonnes. China's July LNG imports were estimated at 5.62 million tonnes, the highest since January, as buyers rebuilt inventories after the March–June disruption period. The IEA noted that Asian gas demand fell 0.5% in the first half overall, with China's March–June gas demand down 4% and LNG imports down 12% — making July's recovery a rebound from a disrupted base rather than a sign of accelerating underlying demand.
Coal: The Substitute Fuel
Higher LNG costs encouraged price-sensitive buyers to favor thermal coal, and Chinese coal-fired generation had increased for six consecutive months by July. China's 2026 coal-output growth was projected to be the slowest in a decade, creating a supply constraint that supported seaborne coal prices even as metallurgical demand remained soft. High-grade Australian coking coal was $238.90 per tonne on July 10, down 1.3% from mid-June, reflecting weak China and India steel demand. Thermal coal, by contrast, benefited from the LNG substitution dynamic.
Indonesia tightened supply through production reductions and export-policy shifts, adding a supply-side dimension to the coal market's support. India's coal imports rose nearly 9% in February, though mid-July coking-coal buying was subdued and domestic power-station inventories were reported adequate. The coal market is therefore split: thermal coal benefits from energy-security demand and LNG substitution, while metallurgical coal faces the same weak steel-production environment that is weighing on iron ore.
Iron Ore: Stockpiling, Not Consumption
Iron ore's price below $100 per tonne is the most counterintuitive data point in Asia's commodity complex. China imported 628.86 million tonnes in the first half of 2026, up 6.3% year on year, with June imports rising 15.3% month on month. Yet Chinese crude-steel production fell 2.7% year on year in May and was down 3.9% for the January–May period. The reconciliation is inventory accumulation: China is importing ore faster than it is consuming it in steel production, building port stockpiles that represent future supply rather than current demand.
For iron ore prices, this distinction is critical. Stockpiling can support import volumes and shipping rates without providing the sustained price floor that genuine consumption demand would create. When inventories reach saturation levels, purchasing slows regardless of underlying production needs. India offers a partial offset: Indian iron-ore imports were projected to reach a seven-year high in fiscal 2025–26 due to insufficient domestic high-grade ore supply, and global miners are increasingly viewing India and ASEAN as growth markets. But India's current import volumes are a fraction of China's, and the demand shift is a multi-year transition rather than an immediate price catalyst.
Copper: Structural Demand Meets Supply Fragility
LME copper traded in a broad $13,371–$14,196 per tonne range during Q2 2026, after reaching a nominal record of $14,527.50 in January. Analysts cited a potential 450,000-tonne supply deficit for 2026. China accounts for roughly 57%–60% of refined copper consumption, and Chinese imports fell 25% in the first two months of the year before reportedly reaching a nine-month high by July — a pattern consistent with destocking followed by restocking rather than a fundamental demand collapse.
Copper's demand base is shifting. AI data centers, power grids, renewable energy installations and electric vehicles are replacing property construction as the primary growth driver. India's copper demand was projected to grow by more than 30% to above 1 million tonnes, while U.S. demand was projected to rise 50% from 2026 levels to 2.2 million tonnes by 2031. Supply risks include disruption at Grasberg and Kamoa-Kakula, declining Chilean output and fuel constraints in Peru. The Hormuz disruption also affected sulfur and sulfuric acid inputs used in copper processing, adding a geopolitical dimension to the supply-side story.
APAC Currencies: The Physical-Trade Transmission Channel
Physical commodity flows translate into currency movements through trade balances and corporate earnings. USD/JPY near 163.14 reflects Japan's energy import burden — a weak yen magnifies the yen cost of every dollar-denominated LNG and oil cargo. AUD/USD near 0.7009 reflects Australia's iron-ore and LNG export revenues, which are sensitive to both Chinese demand and commodity prices. USD/CNY held around 6.77–6.79 in July, supported by PBOC midpoint management despite slower Q2 growth. USD/KRW near 1,485 in mid-July reflected technology outflows and geopolitical uncertainty, while USD/INR at 96.23–96.24 on July 21 reflected oil import pressure and FII selling.
The overnight global channel added another layer. U.S. June CPI reportedly fell 0.4% month on month and rose 3.5% year on year, initially reducing the implied probability of a July Fed increase from 42% to 17%. Subsequent Fed official comments restored inflation concern, and the S&P 500 fell 1.6% and the Nasdaq 2.9% in the week ended July 17. A weaker U.S. technology sector reduces risk appetite for Asian equities and commodities simultaneously, while Fed hawkishness supports the dollar and pressures commodity-importing currencies. Asia's commodity rerouting is therefore not just a physical-trade story — it is embedded in a global financial context where U.S. monetary policy and Middle East diplomacy remain the dominant variables.
This content is for informational purposes only and does not constitute financial advice. Always consult with a qualified financial advisor before making investment decisions.
Discussion