Gold vs Silver 2026: Two Precious Metals, Two Different Investment Cases
Investors who treat gold and silver as a single "precious metals" trade are combining two fundamentally different markets into one position. Gold's primary demand engine in 2026 is central-bank reserve allocation and macro hedging. Silver's primary demand engine is industrial consumption — solar panels, electric vehicles, AI data centres and grid infrastructure. The two metals share a monetary sensitivity, but their underlying supply-demand dynamics are distinct enough to warrant separate analytical frameworks.
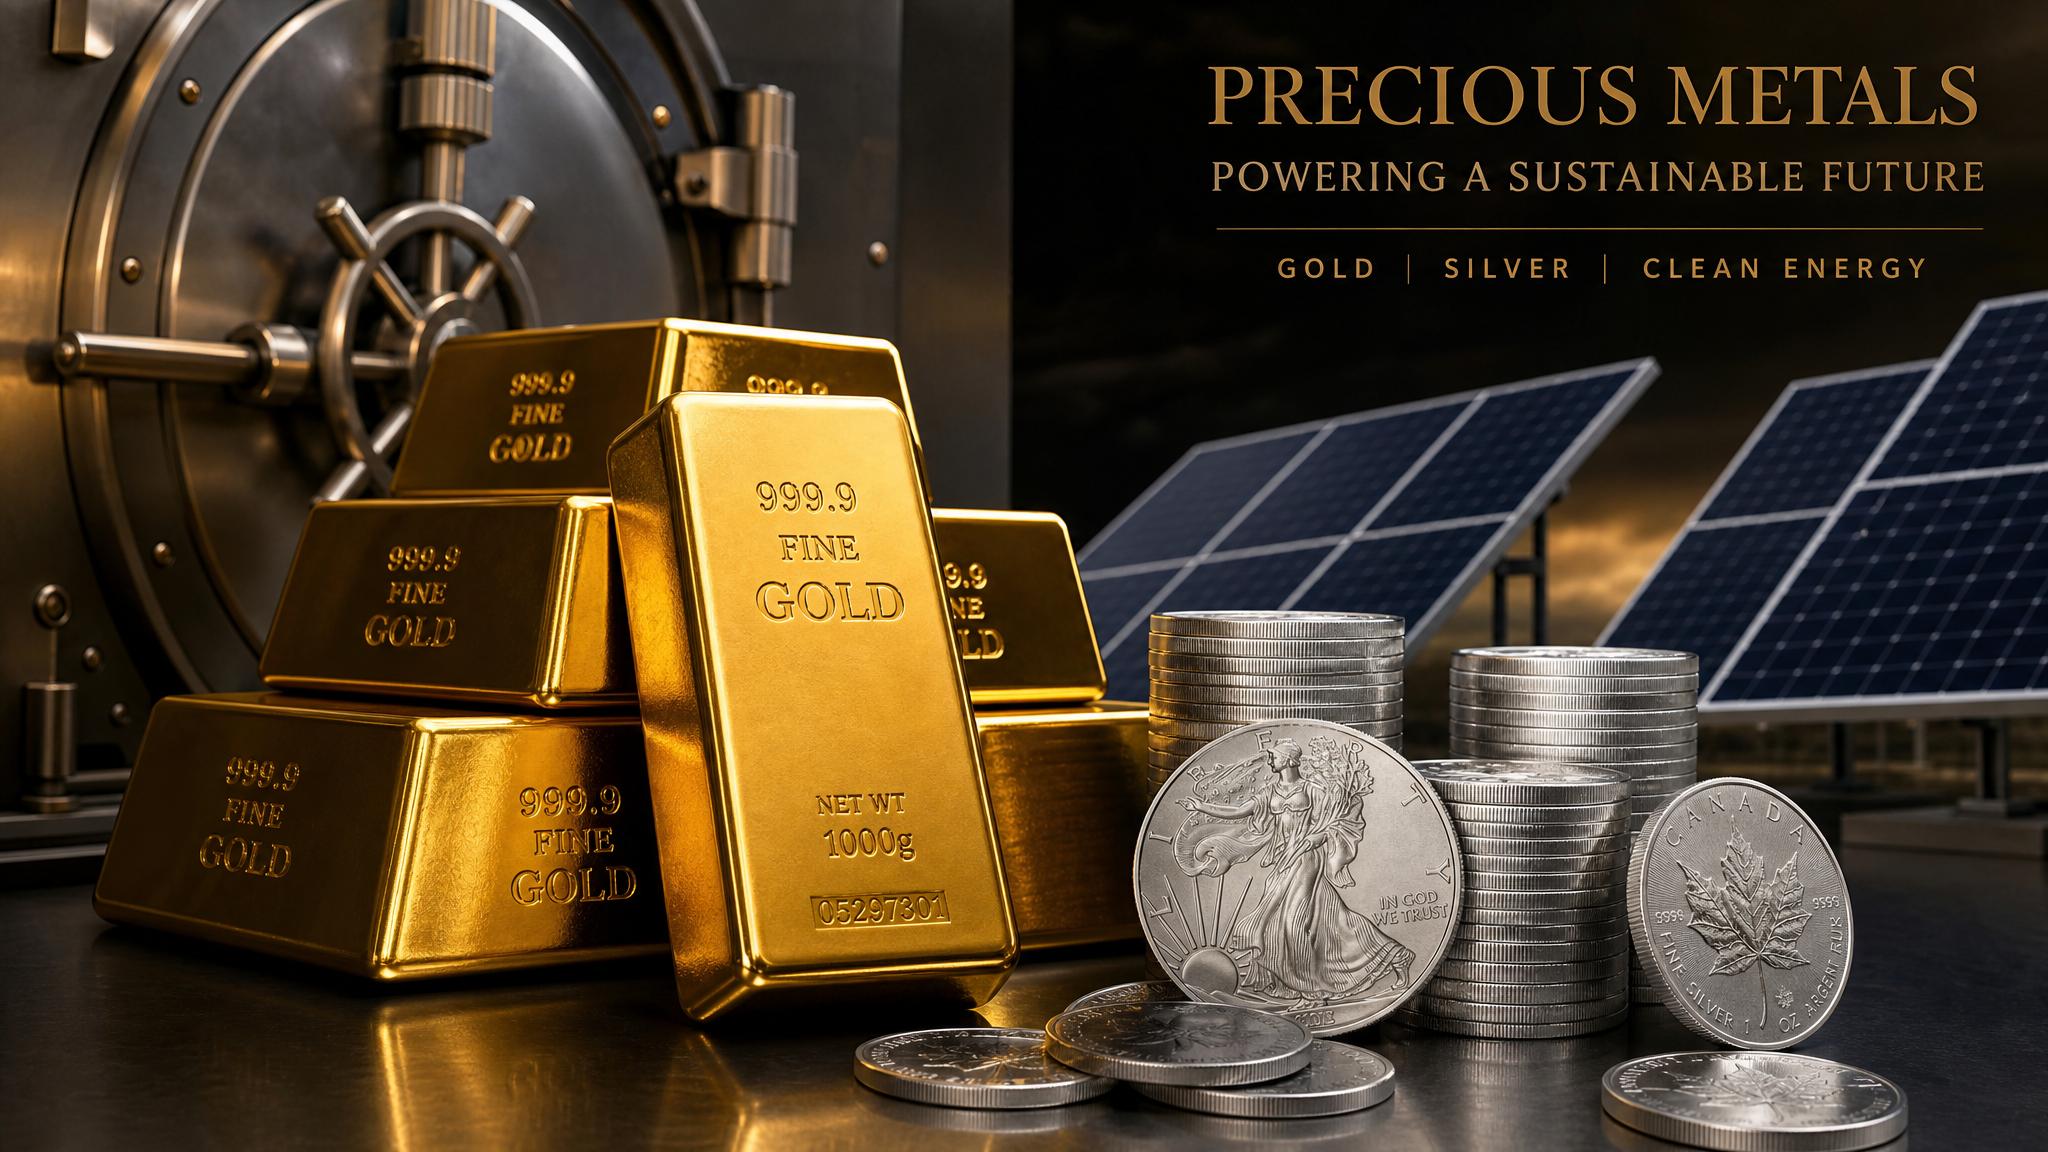
Gold's Volatile First Half
Gold traded above $5,500 an ounce in January 2026 before correcting to the $4,000–$4,050 range in the available late-June and July context. The correction reflects a combination of profit-taking, a stronger dollar and reduced immediate safe-haven demand as some geopolitical risk premiums faded. But the structural buyer base that drove the January peak remains largely intact.
Central banks purchased a net 244 tonnes of gold in the first quarter of 2026, up 17% quarter on quarter and above the five-year quarterly average. A further 41 tonnes were added in May. Poland accumulated 64 tonnes through May, while China continued a multi-month buying sequence. The World Gold Council's annual survey found that 89% of central banks expected global official gold holdings to increase over the next 12 months, and 45% expected to increase their own institution's holdings. Seventy-four percent expected the dollar's share of global reserves to decline over five years.
The Central Bank Demand Floor
The World Gold Council-related forecast projects approximately 850 tonnes of central-bank purchases in 2026, compared with 863 tonnes in 2025. This is a forecast rather than a completed flow, but it reflects a structural shift in reserve management that has been building since 2022. Central banks are not abandoning the dollar — the evidence supports gold as a complement used for diversification and crisis protection, not as a replacement for dollar reserves. But the scale of institutional buying provides a demand floor that was absent in previous gold cycles.
Some institutions, including Turkey and Russia, have been reported as sellers in specific periods, but available analysis classifies those sales as tactical rather than a broad abandonment of gold as a reserve asset. The net buying trend across the central-bank community remains positive. For investors, the implication is that gold's correction from January highs does not necessarily signal a structural reversal — it may reflect short-term positioning rather than a change in the underlying institutional demand picture.
Silver's Industrial Demand System
Silver's situation is structurally different. Industrial uses account for an estimated 56%–60% of total silver consumption, making the metal's price sensitive to manufacturing activity, electrification trends and technology investment in a way that gold is not. Solar silver demand is forecast to fall 19% in 2026 to approximately 151 million ounces because of thrifting — manufacturers are using less silver per solar cell as technology improves. But this reduction in intensity does not eliminate solar demand; it reduces the rate of growth rather than reversing it.
Electric vehicles use an estimated 25–50 grams of silver per vehicle, approximately twice the quantity used in internal-combustion vehicles. As EV penetration increases globally, this demand source grows. AI data centres and grid infrastructure add further demand through switches, relays and power distribution components. The projected 2026 market deficit is 46.3 million ounces, and a cumulative 762.1 million ounces have reportedly come out of above-ground stocks since 2021.
The Supply Constraint
Silver's supply response to higher prices is structurally limited. Approximately 70%–75% of silver production is a by-product of copper, lead and zinc mining. This means that silver output is largely determined by the economics of base-metal mining rather than by the silver price itself. When silver prices rise, primary silver miners can increase output, but they represent only a quarter to a third of total supply. The by-product constraint makes silver's supply curve relatively inelastic, which amplifies the price impact of demand changes.
The gold-silver ratio stood near 69:1 in mid-July. Historically, a high ratio has sometimes indicated that silver is undervalued relative to gold, though this relationship is not mechanically reliable. The ratio reflects the different demand systems of the two metals as much as any relative mispricing.
A Practical Portfolio Framework
For investors, the practical implication is that gold and silver serve different portfolio functions. Gold is most useful as a strategic reserve-diversification and macro hedge — it responds to real-rate expectations, currency confidence and risk-off demand. Silver offers higher-volatility exposure to electrification, industrial activity and physical scarcity. An investor who wants both monetary protection and industrial-demand exposure needs to hold both metals, not treat one as a proxy for the other.
Structural demand does not eliminate price risk for either metal. High real interest rates, a stronger dollar and investor-liquidation pressure can dominate over shorter horizons. The January-to-July correction in gold illustrates that even a metal with strong institutional buying can experience significant drawdowns when financial conditions tighten. Silver's higher volatility amplifies both the upside and the downside relative to gold.
This content is for informational purposes only and does not constitute financial advice. Always consult with a qualified financial advisor before making investment decisions.
Discussion