Oil Outlook 2026: OPEC+, Demand and the Q4 Inventory Build
Oil markets in 2026 have been defined by sharp swings between geopolitical risk premiums and fundamental supply-demand realities. Brent averaged $85 a barrel in June — $22 below May and $32 below the April peak — as the initial shock premium faded. The EIA's July outlook now projects Brent averaging $74 in the third quarter and a significant shift in the global inventory balance: from a 2.2 million-barrel-a-day draw in Q3 to a 2.7 million-barrel-a-day build in Q4. For investors focused on EMEA energy markets, the structural balance question may matter more than the latest spot-price spike.
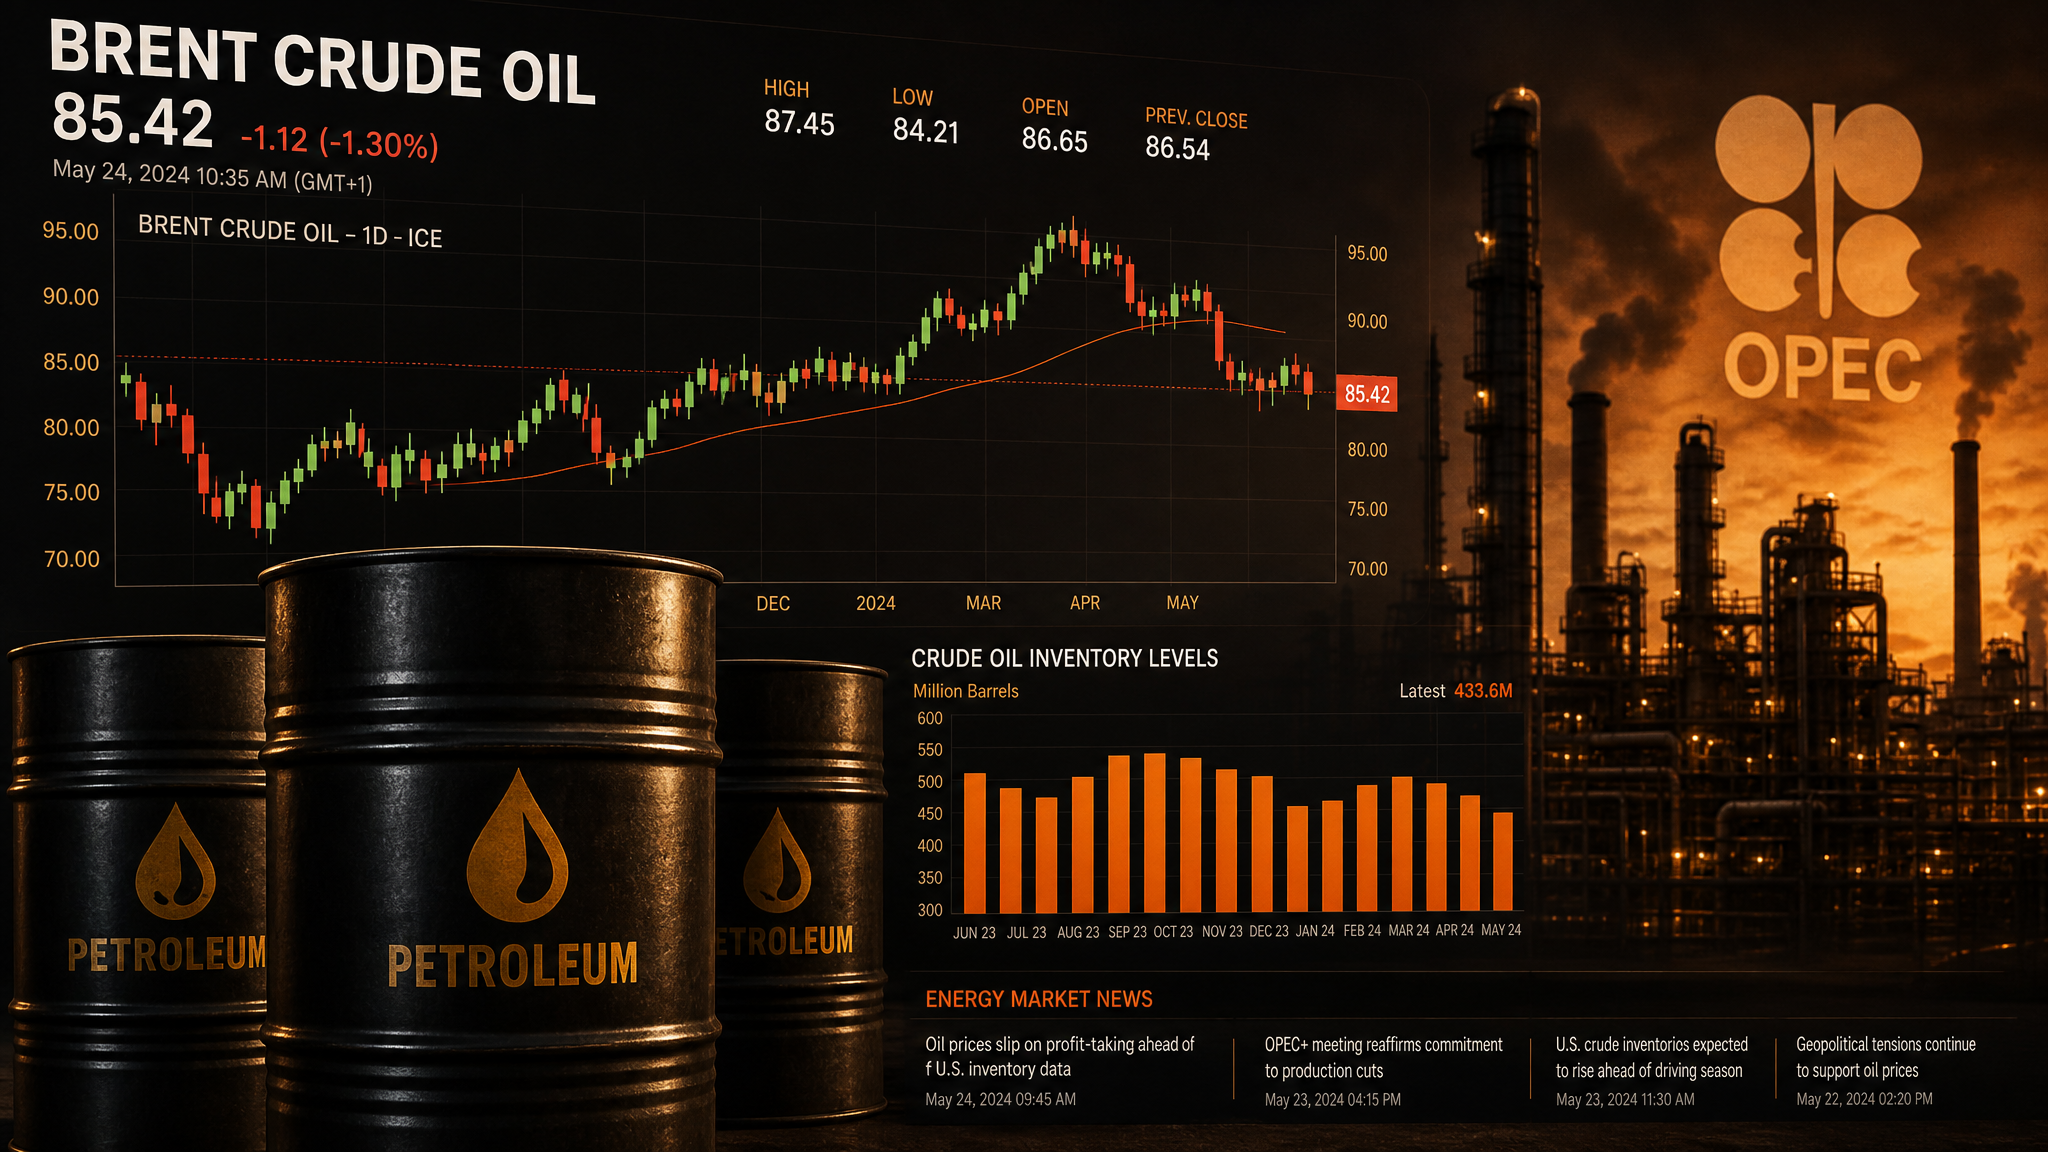
The Supply Picture: OPEC+ and Non-OPEC Growth
OPEC+ implemented a 188,000-barrel-a-day quota increase for July, with a similar adjustment expected for August. The actual additions may be smaller than the headline quotas suggest, because some members cannot fully meet higher targets and others face logistical constraints. Nevertheless, the direction of travel is clear: the alliance is gradually unwinding the production cuts that supported prices through 2024 and 2025.
Non-OPEC supply growth is adding to the pressure. The United States, Brazil, Guyana and Argentina are all contributing incremental barrels to the global market. The EIA forecasts global oil consumption falling by 1.2 million barrels a day in 2026, followed by a 2.0 million-barrel-a-day rebound in 2027. The combination of rising supply and temporarily weaker demand creates the conditions for the projected Q4 inventory build.
The Inventory Trajectory
The EIA's quarterly inventory path is the central analytical framework for understanding where prices may be heading. Global inventories are forecast to decline by 2.2 million barrels a day in Q3 — a draw that reflects seasonal demand patterns and the lag between quota increases and actual production. But the Q4 picture changes materially: a projected 2.7 million-barrel-a-day build, followed by a 5.0 million-barrel-a-day build in 2027, would represent a significant shift in market structure.
U.S. commercial crude inventories increased by 2.0 million barrels in the week ending 17 July to approximately 411.7 million barrels, providing early evidence that the supply-demand balance is beginning to shift. Early-July market structure moved into mild contango — a configuration where forward prices exceed spot prices — suggesting better prompt supply and improving storage economics. Contango is typically associated with a well-supplied market rather than a tight one.
Crude Versus Products: The Diesel Divergence
One important nuance in the current oil market is the divergence between crude and refined products. Diesel and other middle distillates have remained tighter than crude because of refining constraints, keeping crack spreads elevated despite softer flat crude prices. This means that the full benefit of lower crude prices has not yet reached transport-intensive businesses and consumers. For EMEA economies that are large diesel consumers — including Germany, France and Turkey — the product market matters as much as the crude benchmark.
The EIA projects Brent averaging $65 a barrel in 2027, a level that would represent a substantial decline from current prices. This forecast is conditional on supply restoration proceeding as planned and demand remaining subdued. If actual OPEC+ output falls short of announced quotas, or if demand recovers more quickly than expected, the inventory build may be smaller and the price decline less pronounced.
EMEA Transmission Channels
The oil price outlook has different implications for different parts of the EMEA region. Energy-importing economies — including most of Europe and Turkey — benefit from lower crude prices through reduced import costs and eased inflation pressure. The ECB's June inflation data already showed energy contributing 0.77 percentage points to headline HICP, and a sustained decline in Brent would reduce that contribution further.
Energy-exporting economies in the Middle East and North Africa face the opposite dynamic: lower prices reduce fiscal revenues and can force adjustments to government spending plans. Gulf states with large sovereign wealth funds have more buffer than smaller producers, but a sustained move toward $65 Brent would test fiscal breakeven prices across the region.
The IMF advises countries with limited fiscal space to use targeted, temporary support rather than broad subsidies or price caps when energy shocks hit. That guidance is relevant for EMEA economies that have used energy subsidies to cushion consumers from price volatility — the fiscal cost of those subsidies rises when prices spike and falls when they decline, creating a procyclical fiscal dynamic that can complicate monetary policy.
The Risk Scenario
The EIA's Q4 inventory build is a scenario, not a certainty. Late-July market reports have described Brent approaching $96 intraday amid renewed disruptions, illustrating how quickly the spot price can diverge from a conditional balance forecast. Investors should treat the EIA outlook as a baseline that assumes normalized supply flows and moderate demand — a baseline that can be overtaken by events. The Q4 inventory build will only materialise if OPEC+ actually delivers its planned output increases and if demand does not recover more quickly than the EIA projects.
This content is for informational purposes only and does not constitute financial advice. Always consult with a qualified financial advisor before making investment decisions.
Discussion