Wall Street's July 23 Selloff: Rising Yields, Oil Shock, and the Limits of Broad Participation
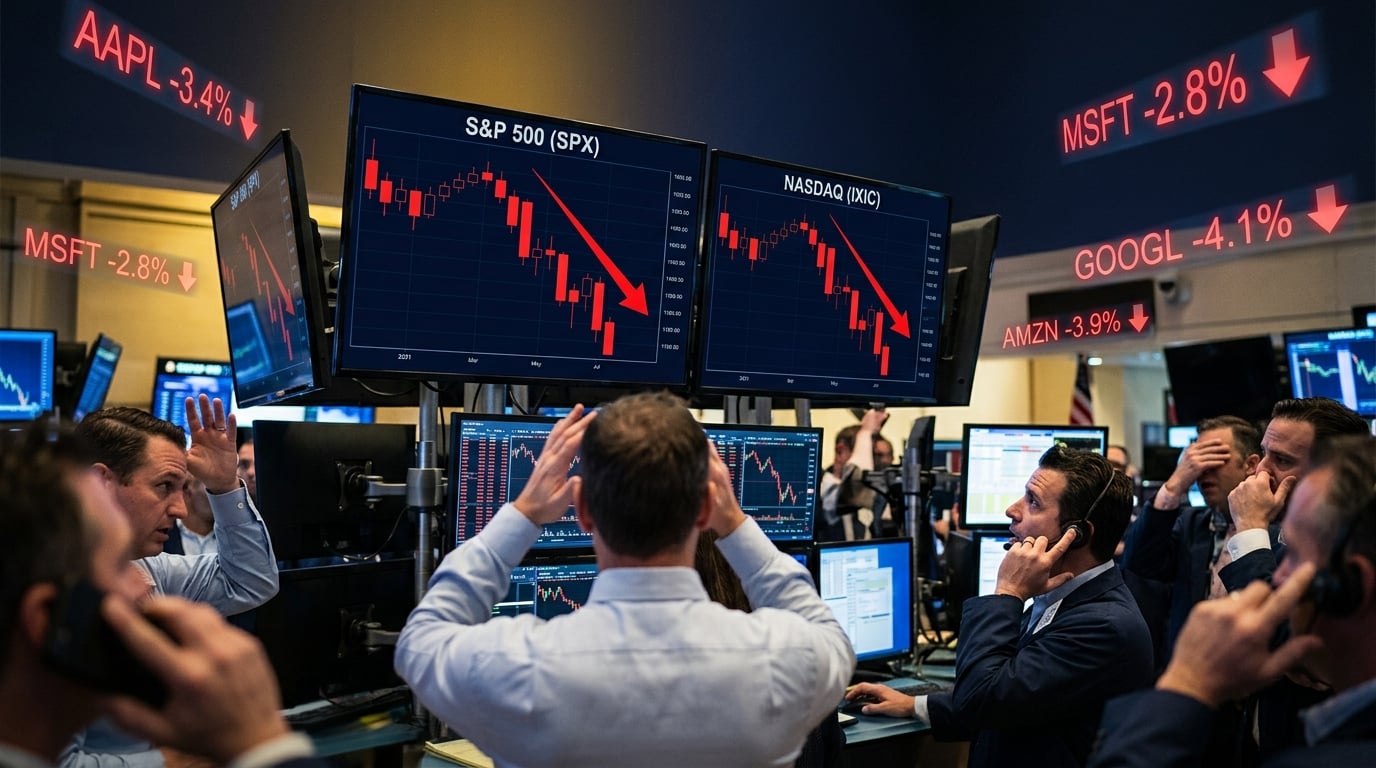
U.S. equity markets suffered a broad retreat on July 23, 2026, as a convergence of higher energy prices, rising Treasury yields, and an unforgiving earnings season combined to push the S&P 500 down 1.97% to 5,580.94 and the Nasdaq Composite down 2.70% to 17,322.99. The session underscored a fragile dynamic that had been building for weeks: participation in the summer rally was already losing momentum before the latest catalyst arrived, and the market's ability to absorb simultaneous macro shocks was being tested in real time.
A Three-Session Deterioration
The July 23 decline did not emerge in isolation. On July 21, all four major U.S. benchmarks posted gains — the S&P 500 rose 0.40%, the Dow Jones Industrial Average advanced 0.26%, the Nasdaq gained 1.36%, and the Russell 2000 added 0.37%. July 22 brought a modest reversal, with the S&P 500 slipping 0.14%, the Dow edging down 0.01%, and the Nasdaq declining 0.57%. By July 23, the losses had accelerated materially, with the Nasdaq underperforming the broader index by a significant margin — a pattern consistent with rising discount rates hitting longer-duration growth equities harder than value-oriented names.
The Nasdaq's larger decline relative to the S&P 500 reflects the mathematical sensitivity of high-multiple technology stocks to changes in the risk-free rate. When the 10-year Treasury yield climbs, the present value of earnings expected years into the future falls more sharply for companies whose valuations rest on distant cash flows. That dynamic was clearly at work on July 23, as bond markets repriced the inflation and policy outlook simultaneously.
Oil, Yields, and the Inflation Feedback Loop
Escalating Middle East tensions pushed crude oil prices sharply higher during the session. WTI crude moved toward $94 per barrel, while Brent crude was reported near $98 and, in later intraday evidence, briefly above $100. The energy spike revived concern about persistent cost pressure at a moment when investors had been hoping that the Federal Reserve's restrictive policy stance was finally cooling inflation. A sustained move above $100 in Brent would complicate that narrative considerably, adding to headline consumer price readings and squeezing corporate margins in transportation, manufacturing, and consumer-facing industries.
The oil-yield feedback loop is the central mechanism behind the July 23 selloff. Higher energy costs raise inflation expectations, which in turn push bond yields higher, which increases the discount rate applied to equity valuations, which depresses stock prices — particularly in rate-sensitive sectors such as real estate, utilities, and consumer staples, all of which faced reported pressure during the session.
Breadth Was Already Cooling Before the Selloff
Mid-July participation data — the most recent available — showed that 64.6% of S&P 500 constituents were trading above their 50-day moving averages and 68.2% were above their 200-day moving averages. While those readings remained above the 50% threshold that typically distinguishes a healthy market from a deteriorating one, the 10-day average of net new 52-week highs had already fallen to 4.8%, down from 6.3% earlier in July. That declining new-high activity suggested that the rally's internal momentum was fading even before the July 23 shock arrived.
It is important to distinguish between these mid-July breadth readings and a same-day advance-decline tally for July 23. The participation data establish that the market was losing momentum heading into the session; they do not describe how many stocks rose or fell on the day itself. A full picture of July 23 breadth will require the next verified advance-decline release.
Earnings Season Raises the Bar
The selloff also unfolded against the backdrop of a dense second-quarter earnings calendar. With a large number of major companies reporting results this week, investors were not simply reacting to macro data — they were also evaluating whether corporate guidance justified the premium valuations embedded in index levels. In an environment where merely beating consensus estimates was no longer sufficient, companies that failed to raise full-year outlooks or that flagged cost pressures in their commentary faced outsized stock-level declines. That dynamic amplified the index-level move, as individual earnings disappointments compounded the macro headwinds.
What to Watch
Several data points will determine whether July 23 marks the beginning of a more sustained correction or a single-session overreaction. The most important are: a verified Dow Jones closing level and percentage move; same-day NYSE and Nasdaq advance-decline figures; the percentage of S&P 500 members above key moving averages after the selloff; and closing oil prices, which varied significantly across intraday reports. Whether the Russell 2000 holds up better or worse than large-cap benchmarks will also signal whether the selling is concentrated in growth names or spreading to the broader market. Investors should also monitor corporate guidance language closely — the interaction between index performance and company outlooks matters more than headline earnings beats in the current environment.
This content is for informational purposes only and does not constitute financial advice. Always consult with a qualified financial advisor before making investment decisions.
Discussion